Mastering DevOps from Start to Finish: Building a Seamless Pipeline for Continuous Delivery
Forget the “DevOps by checklist” approach—piecemeal automation only guarantees operational debt later. A functional DevOps implementation hinges on building an end-to-end pipeline: one that eliminates silos, closes feedback loops, and embodies automation across build, validation, deployment, and runtime monitoring.
1. Source Control: Enforce Structure
No modern pipeline functions without strict source control policies. Git is a given, yet teams still neglect robust branching strategies.
Recommended:
- Enforce mandatory pull requests on the default branch.
- Enable branch protection with required status checks.
- Tag releases using semantic versioning (e.g.,
v1.12.3).
Example GitHub policy: Use CODEOWNERS to ensure that critical services are always reviewed by platform leads.
Gotcha: Relying solely on automation here misses the human element—pull request reviews catch non-obvious design flaws.
2. Automated Build + Static Analysis
Commit, build, analyze. Fast feedback cuts downstream rework.
Integration Example: Jenkins + Gradle + SonarQube (2023.9):
pipeline {
  agent { label 'linux-x86-64' }
  environment {
    JAVA_HOME = '/usr/lib/jvm/java-17-openjdk-amd64'
  }
  stages {
    stage('Checkout') {
      steps { checkout scm }
    }
    stage('Build') {
      steps { sh './gradlew clean assemble' }
    }
    stage('Static Analysis') {
      steps { sh './gradlew sonarqube --info' }
    }
  }
  post {
    failure {
      archiveArtifacts artifacts: '**/build/reports/**', allowEmptyArchive: true
      mail to: 'devops@example.com', subject: '[CI] Build Failure', body: 'Jenkins failed: ${env.BUILD_URL}'
    }
  }
}
Non-obvious Tip: Set SonarQube quality gates to block merges if key metrics (e.g., coverage <70%) fail. Merges that ignore this often trigger production incidents later.
3. Continuous Integration Testing: Coverage + Isolation
- All pull requests trigger unit tests (
pytest,JUnit 5). - Integration tests run against ephemeral containers spun up via Docker Compose.
- Coverage tooling (e.g.,
nycfor Node,Jacocofor Java) wired into CI.
Typical error output when coverage fails:
[ERROR] Coverage check failed: 65.2% < 80.0%
Build step 'Execute shell' marked build as failure
Note: Parallelizing tests with GitHub Actions matrix jobs or self-hosted GitLab Runners speeds up feedback dramatically. Be wary of test data collisions when parallelism is high.
4. Containerization: Deterministic Builds
Standardize runtime environments across the board.
- Dockerize apps, pin all version tags in
Dockerfile(notlatest). - Use multi-stage builds for smaller images.
- Integrate vulnerability scans (e.g., Trivy v0.48, nightly) post-build.
Typical Dockerfile gotcha:
FROM node:20-alpine AS build
...
Side Note: Don’t trust base images implicitly. Include a scheduled scan (trivy image your/app:tag) in CI—high-severity CVEs slip in frequently even on “official” images.
Tag containers using commit SHA and Semantic Version, e.g., service:1.3.4-5e7acfb.
5. Continuous Deployment: Rollout with Confidence
Promotion must be automated, yet gated.
- Use Infrastructure as Code (Terraform 1.6, Helm 3.13) for environment setup.
- Argo CD or Flux for declarative GitOps-driven deployments to Kubernetes.
- Blue-Green or Canary releases where possible. Manual approvals can block production if risk is not acceptable—use SlackOps bots for runtime approval on critical paths.
Real pipeline fragment (Argo CD sync):
apiVersion: argoproj.io/v1alpha1
kind: Application
...
syncPolicy:
  automated:
    prune: true
    selfHeal: true
  retry:
    limit: 3
Trade-off: Full automation reduces wait times, but explicit approvals can be prudent for data-migrating microservices.
6. Monitoring, Observability, Feedback
Shipping ≠ done. Immediate telemetry is how you avoid post-mortems.
- Application/infrastructure monitoring: Prometheus 2.49, Grafana 10. APM: Datadog, New Relic.
- Log aggregation: EFK (Elasticsearch, Fluent Bit, Kibana) pipeline, tailored index retention.
- Alerts routed via PagerDuty, annotated Slack incident channels.
Practical feedback loop: Instrument critical user paths with custom metrics, e.g., checkout latency p95. Feed regressions as Jira tickets into next sprint’s review—don’t let “monitoring” mean only uptime checks.
Known Issue: Monitoring stack drift—keep dashboards under version control (grafonnet or Grafana Dashboard API), or dashboards rot.
Phase Checklist: Technical Reference
| Stage | Critical Tactic | Tooling / Example |
|---|---|---|
| Source Control | PR reviews, CODEOWNERS | GitHub, Bitbucket |
| Build & Lint | CI pipelines, block on failure | Jenkins, SonarQube |
| Testing (CI) | Coverage & fast isolation | Pytest, JUnit, Jacoco |
| Containerization | Immutable tagging, image scan | Docker, Trivy |
| Deployment | GitOps CD, progressive delivery | Argo CD, FluxCD, Helm |
| Monitoring/Feedback | Custom metrics, alerting | Prometheus, Datadog, PagerDuty |
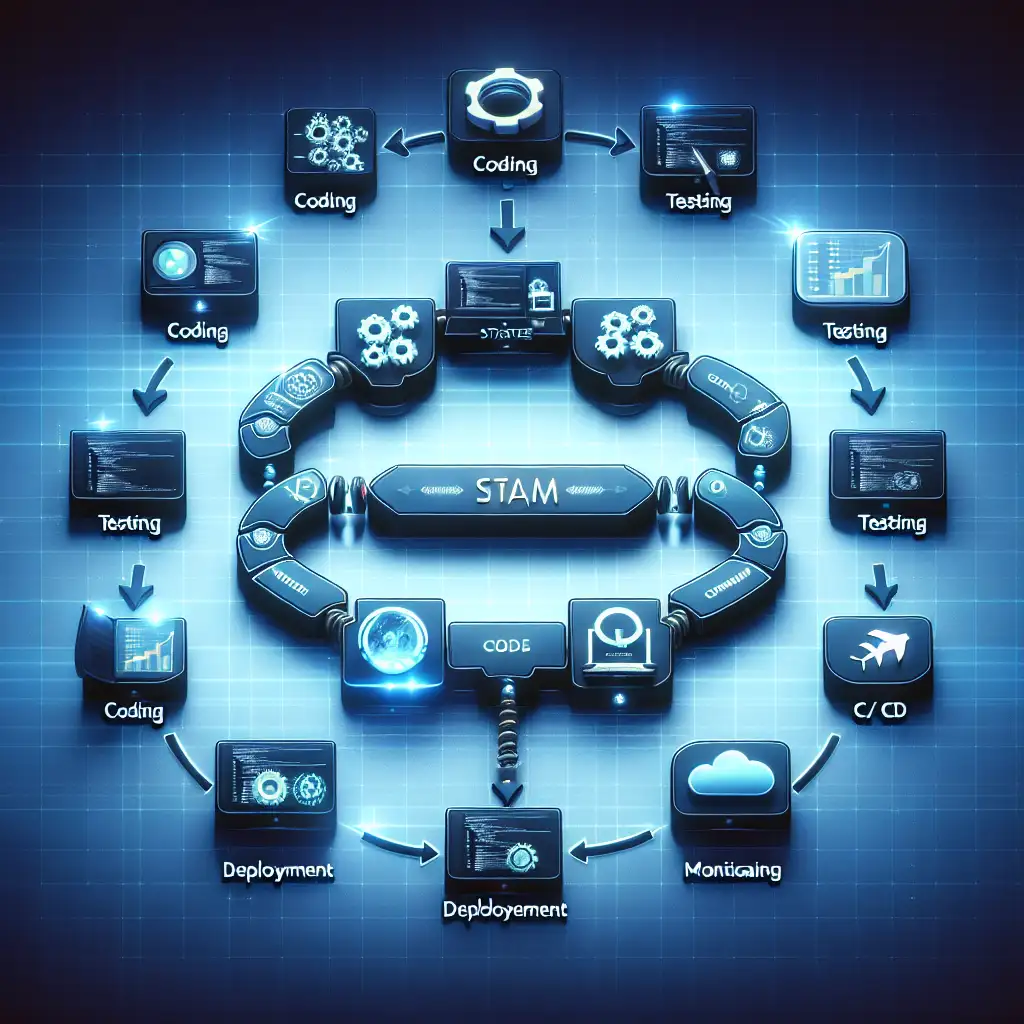
Diagram: Example DevOps Pipeline
[Git Push] -> [CI Build/Test] -> [Image Build/Scan] -> [Deploy: ArgoCD] -> [Monitor/Alerting]
Closing
Many pipelines are “semi-DevOps”—build scripts here, a deployment job there, and monitoring tacked on last. Integration and repeatability matter more. Teams relying on partial automation can’t scale safely or respond rapidly to incidents.
Deploy smart, monitor closely, close feedback loops—then iterate. The details aren’t exciting, but outages rarely are either.
For example config files (Terraform modules, Grafana dashboard JSONs), or advice about noisy CI flakes—or if you want to debate Helm charts vs. Kustomize—send a note.
